Automating Tasks With X64dbg Scripts
A short overview of x64dbg
According to x64bg website, it is an open-source x64/x32 debugger for windows. You can find an extensible list of features there.
If you are generally interested in reverse engineering, you’ll undoubtedly use x64dbg and I’m sure you’ll love it. Thanks for the fantastic tool mrexodia.
What are x64dbg scripts?
x64dbg scripts are small chunks of instructions that are executed step by step. All the script commands are described here. Let’s start with a “Hello World!” as usual.
We can do it in two different ways: log command or msg command. Both of them are super easy to work with!
How can we use it?
It is possible to execute these commands directly on the script tab, save a file, and load it on the script part, or type both in the command bar. In the first example, I used the command bar to execute the script.
Some simple examples
Log command
log "Hello World!"
Msg command
msg "Hello World!"
Using it in real life
Getting the first malware sample
On MalwareBazaar I’ve collect a DarkGate sample to start our analyzis.
First documented in 2018, DarkGate is a commodity loader with features that include the ability to download and execute files to memory, a Hidden Virtual Network Computing (HVNC) module, keylogging, information-stealing capabilities, and privilege escalation. DarkGate makes use of legitimate AutoIt files and typically runs multiple AutoIt scripts. New versions of DarkGate have been advertised on a Russian language eCrime forum since May 2023.
Understand it, first part
This sample dropped an AutoIt and started it, so it was not a good choice in this example of x64dbg scripts. At that time, I had just opened the MalwareBazaar website and collected the first sample. So, I’ve decided to keep it to show another option (a quite simple one).
When I opened the debugger, I focused on creating the process. My thoughts were to use CreateProcessA to collect the second parameter, which is the command line, and log it.
Crafting the easiest script in the world
// Go to entrypoint
run

// Clear all breakpoints
bpc
bphc
bpmc

// Set the breakpoint
bp CreateProcessA
run

// Log the commandLine argument
log "[+] {s:esp+8}"

msg "Now, take a look on the LOG tab!"
ret
To load it on the x64dbg, we can find a tab called “Script”.
Right click > Load Script and then load from a file or paste it directly.
And that is the result of running this script.

Really easy, isn’t it? Let’s try another one with more challenges to solve.
Getting the second malware sample
Here I collect a really good example to this post, a MarsStealer sample from MalwareBazaar.
3xp0rt describes Mars Stealer as an improved successor of Oski Stealer, supporting stealing from current browsers and targeting crypto currencies and 2FA plugins.
Understand it, second part
Triage
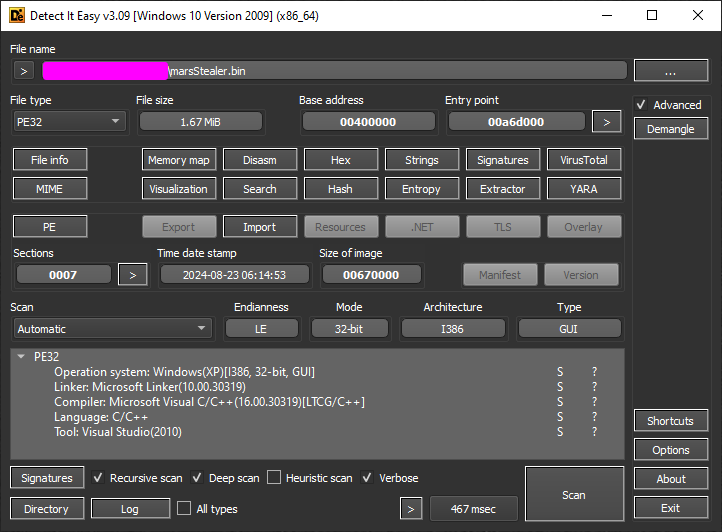
On DiE it does not tell us much about the file, looks like a normal file, right?
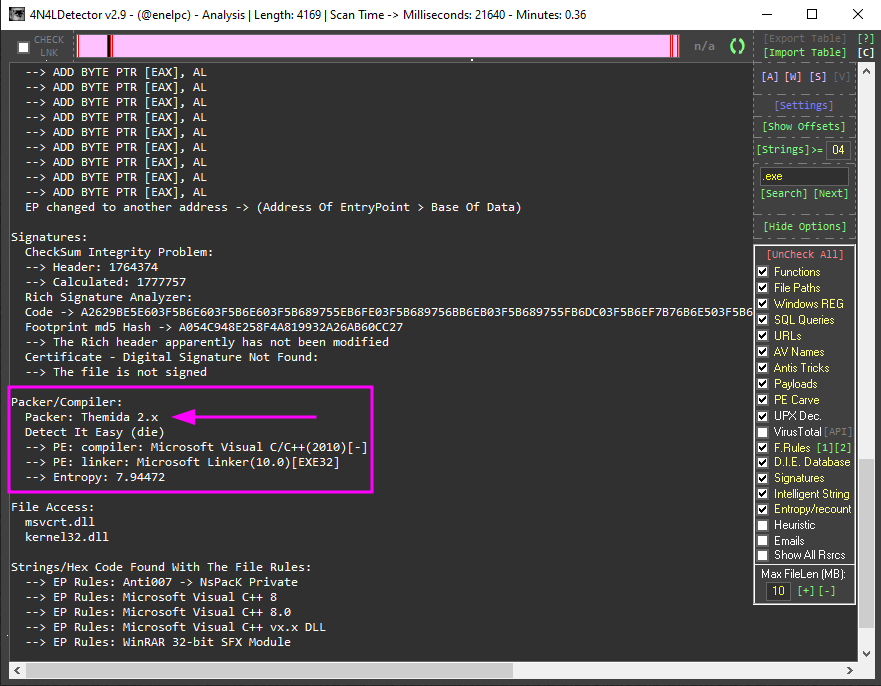
Using a second option to scan, we find out that we are dealing with a version of Themida.
The Themida Script
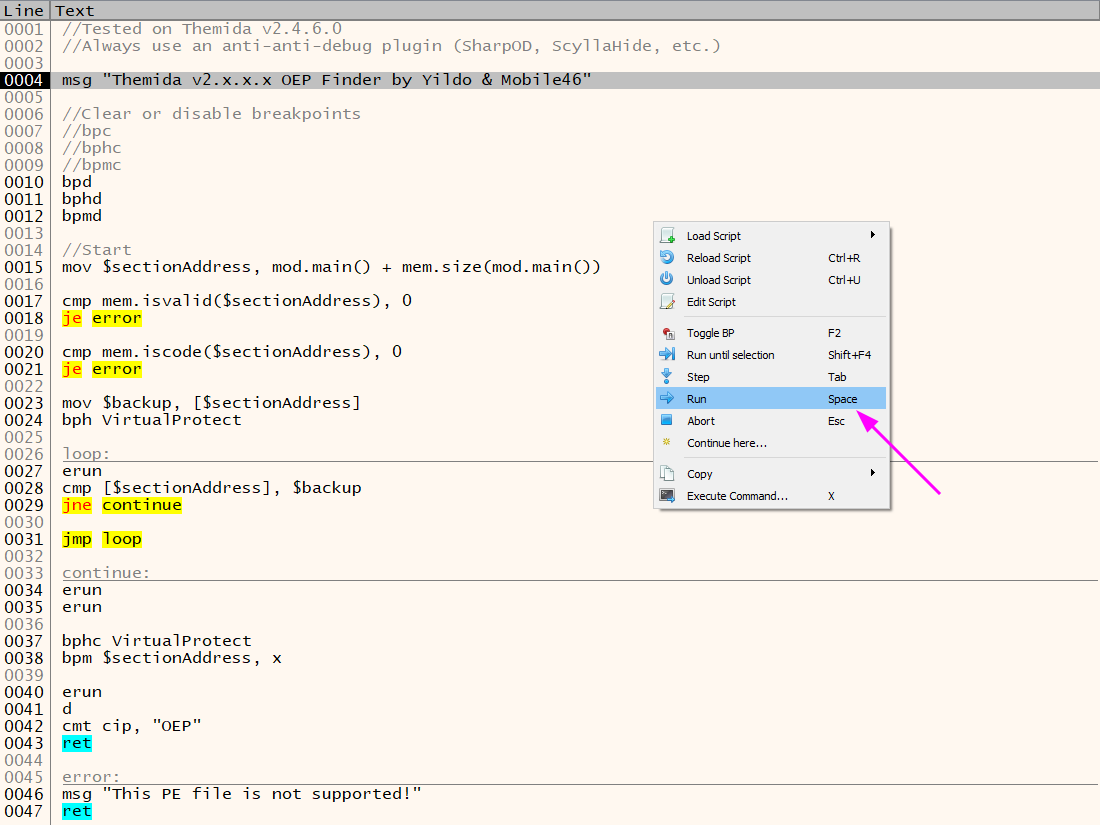
So, this time, I was really lucky! Now, I have a perfect example of how scripts can be helpful in our daily jobs. On the x64dbg Github we found some excellent scripts and fortunately, one of them is a Themida v2.x.x.x OEP Finder by Yildo & Mobile46
One of the first comments there, tell us:
Always use an anti-anti-debug plugin (SharpOD, ScyllaHide, etc.)
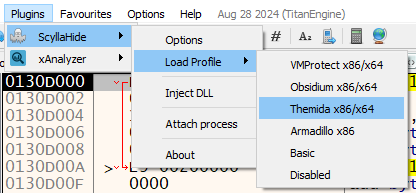
Ok! I’ve setting up my debugger with the Themida profile offered by ScyllaHide.
To run the script, we can press the space bar and wait for the OEP (Original EntryPoint).
After all the steps to execute, we got the OEP.
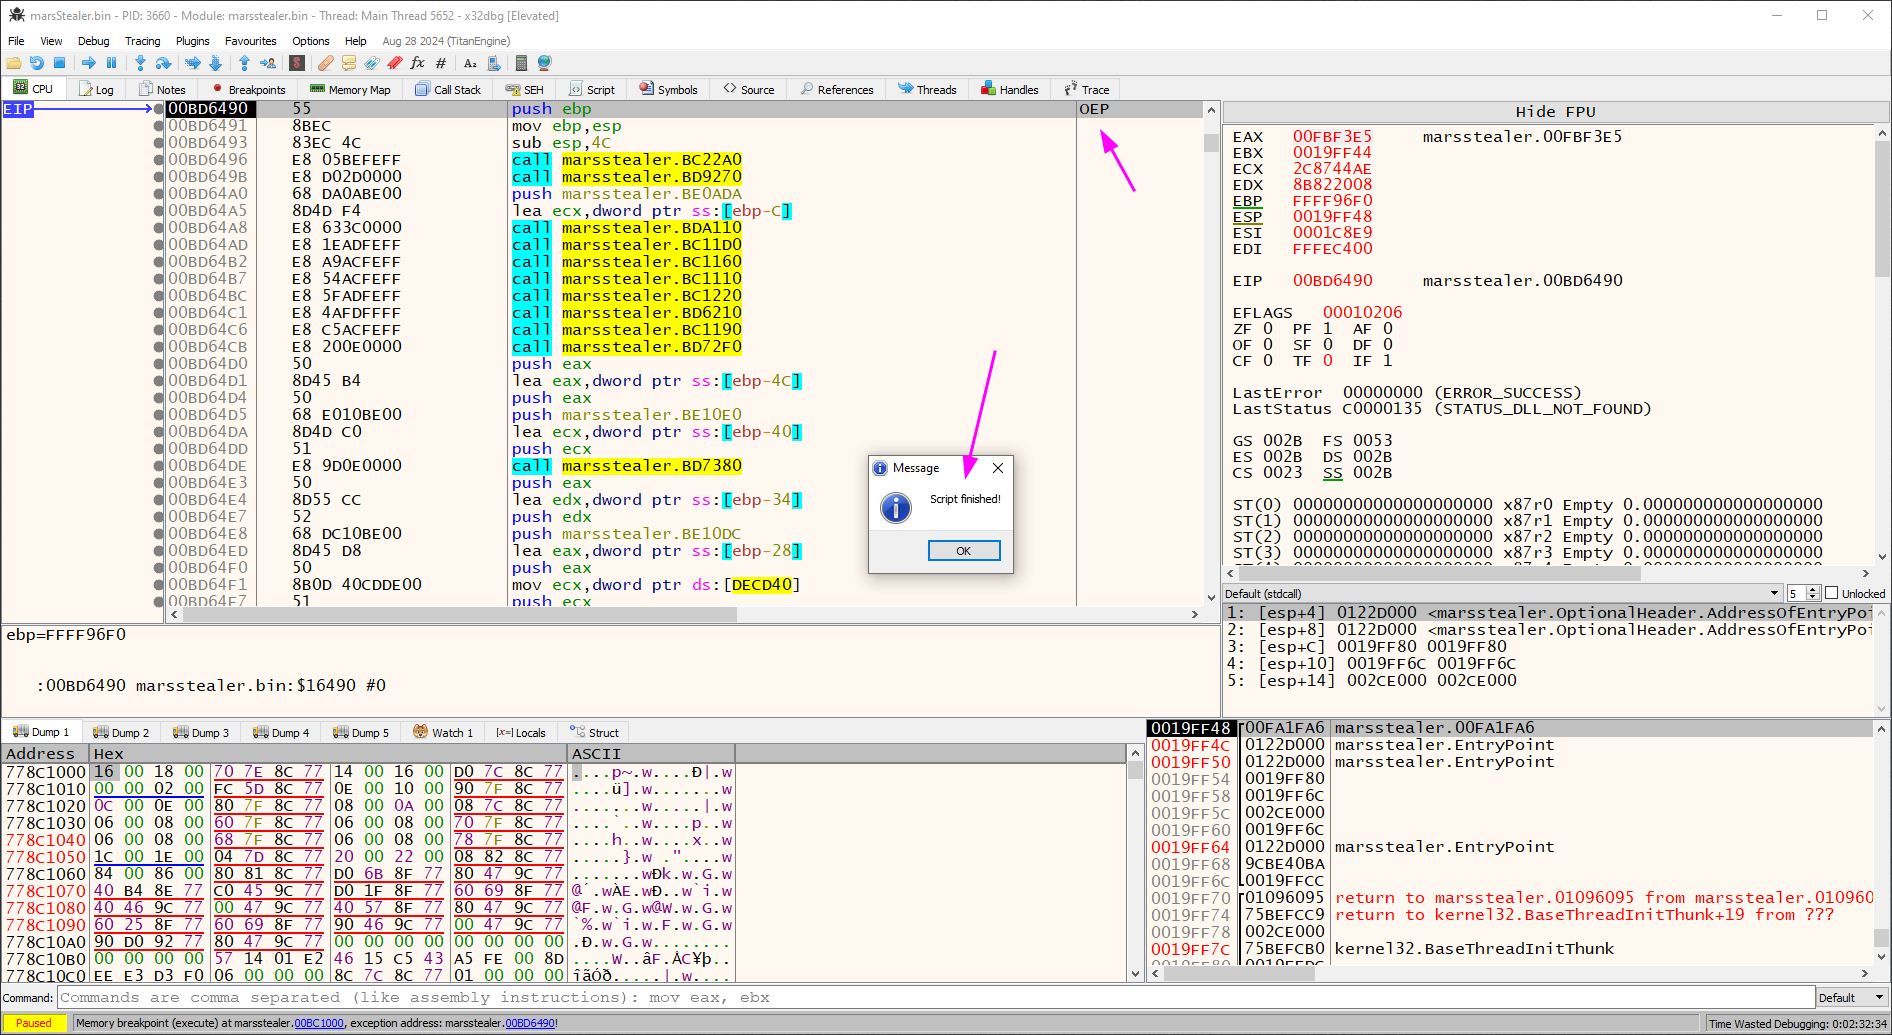
To dump it you can easily use the Scylla with: IAT Autosearch > Get Imports > Dump > Fix Dump.
And then… you can analyze the malware without any problem :)
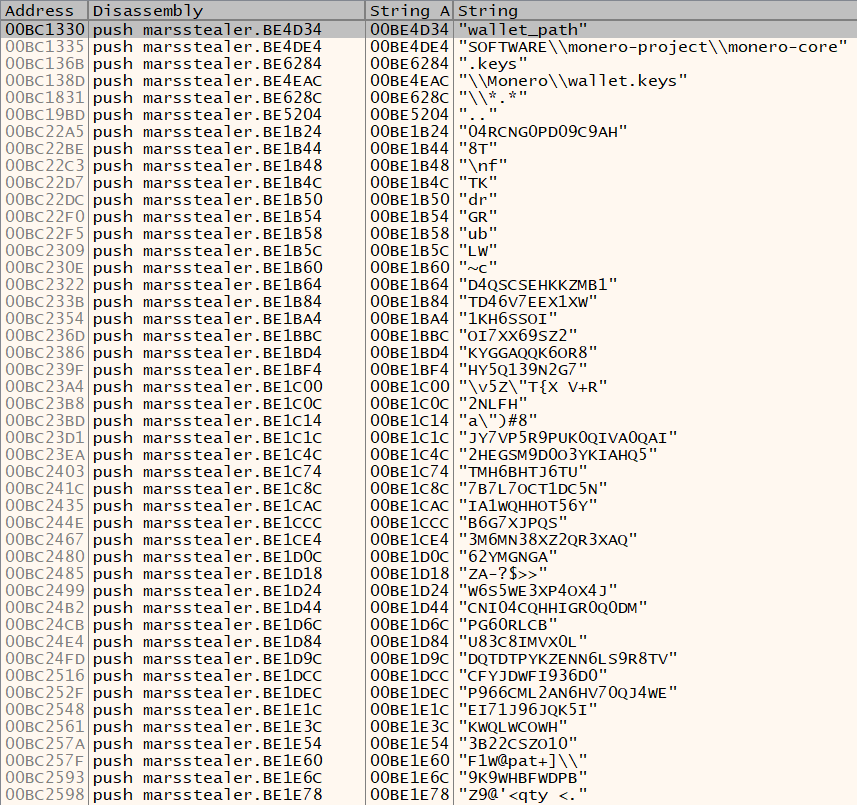
Breaking Down the Script
bpd
bphd
bpmd
These commands are used to clear or disable any existing breakpoints to ensure they do not interfere with the script’s execution:
bpd: Clear all data breakpoints.bphd: Clear all hardware breakpoints.bpmd: Clear all memory breakpoints.
mov $sectionAddress, mod.main() + mem.size(mod.main())It calculates the address where the section starts by adding the size of the main module to the base address of the module.
cmp mem.isvalid($sectionAddress), 0
je error

cmp mem.iscode($sectionAddress), 0
je errormem.isvalid($sectionAddress): Checks if the memory at$sectionAddressis valid.mem.iscode($sectionAddress): Checks if the memory at$sectionAddresscontains executable code.
If either check fails, it jumps to the error label, which outputs an error message.
mov $backup, [$sectionAddress]
bph VirtualProtect
mov $backup, [$sectionAddress]: Saves the current value at$sectionAddressto$backup.bph VirtualProtect: Sets a hardware breakpoint on VirtualProtect, a function used to change memory protection, to monitor modifications.
loop:
erun
cmp [$sectionAddress], $backup
jne continue

jmp looperun: Executes the code until a breakpoint is hit or the process continues.cmp [$sectionAddress], $backup: Compares the current value at$sectionAddresswith the$backupvalue.
If the values are not equal (jne), it jumps to the continue label. Otherwise, it loops, repeatedly checking if the value has changed.
continue:
erun
erun

bphc VirtualProtect
bpm $sectionAddress, x

erun
d
cmt cip, "OEP"
ret
erun (executed twice): Continues the execution until it hits another breakpoint.bphc VirtualProtect: Clears the hardware breakpoint on VirtualProtect.bpm $sectionAddress, x: Sets a memory breakpoint (on execute) at$sectionAddress.erun: Continues execution until the memory breakpoint is hit.d: Disassembles the current address.cmt cip, "OEP": Comments the current instruction pointer (IP) with “OEP”, marking the found Original Entry Point.
error:
msg "This PE file is not supported!"
ret
If the script encounters an unsupported PE file, it outputs an error message and terminates.
Conclusion
You can create scripts to automate most repetitive tasks or make them help, such as unpacking a specific packer, such as Themida.


